One of the features of any election cycle are the numerous polls conducted. These polls paint a narrative about how well a candidate or party is performing at a point in time or over time. And despite the fact that we love to complain about the undue influence of polls, it’s the “horse race” aspect to it that makes polls so popular, especially if “your side” is winning or coming from behind.
Because of the pervasive influence of polls on any election, the great unasked question is: can I trust the polls? At its very essence, a poll is a snapshot of voter opinion at a particular point in time. And the contents of that snapshot can differ depending on who takes the picture due to variables like the quantity of questions asked, the time the poll was conducted, the tone of voice used to ask the questions, which voters are selected for the poll, and how many voters are selected for the poll.
As an illustration of what we are saying, we’d like to analyze data available on the “Generic Congressional Ballot” question. In the past 28 days, this poll question was asked 18 times, and the weighted average of these 18 polls was a 45-42% Republican preference. The detail beneath this number, however, reveals widely divergent results. Rasmussen asked this question three separate times, and the result came back 45-37% Republican. Gallup’s four polls on this very subject yielded a result, however, that was 47-45% Democratic. And FOX News asked this question on three separate occasions, and the result was 43-38% Republican.
Now that we see an example of how polls can produce different results, how can we effectively assess a poll?
(1) Whenever a poll is released, the most important thing is to determine who conducted the poll – was it a candidate/interest group (business, labor, etc) releasing numbers favorable to his/her campaign, or was it a media outlet (newspaper, TV station, magazine) paying for the poll ? And if the media outlet paid for the poll, which polling firm conducted the poll ?
(2) When the poll was conducted is just as important. A poll conducted two days ago is a very good assessment of a candidate’s strength/weakness. A poll conducted in July and released the day before Election Day would pretty much be useless, because (a) of the “staleness” of the data, and (b) the fact that after Labor Day, the tempo of a campaign speeds up as voters traditionally begin to pay more attention than they would right now, and opinions can and do change over time – the 2008 Presidential campaign is a good example of that.
(3) Trends are important: A single poll in itself doesn’t paint as vivid of a picture as a series of polls taken over a period of time, especially if it’s by the same pollster. For example, a Las Vegas Review Journal newspaper poll released yesterday shows Senate Majority Leader Harry Reid (D-Nevada) with a 43-42% lead over his Republican opponent, Sharron Angle. A casual observer would conclude that this race is neck and neck, with a very slight edge to Harry Reid. That is technically a true statement today, but if you look at the historical data, you’ll realize that the last poll conducted by the Review-Journal two weeks ago showed Reid leading 44-37%. Furthermore, in the four times Rasmussen has polled this race since the Nevada primary, Reid’s share of the vote started off at 39%, and increased 2% each time Rasmussen polled this race.
From this detail data, we can make the following assessment of this race: (1) Harry Reid’s use of his considerable campaign war chest to shine the light on his opponent’s statements/beliefs/gaffes has turned the race around for now, and (2) while he has fought his way back, it appears that he has hit a ceiling of support, according to the two Review-Journal polls. Obviously, Sharron Angle will have to change the way she presents her campaign/beliefs to Nevada voters so she can retake the lead before November.
(4) No two polls are created equally – for a poll to be an accurate representation of the electorate, the polling firm must consider the demographic makeup of those who answered the poll and be willing to make adjustments. Let’s look at the Louisiana electorate as an example. The most recent voter registration data shows that 31% of Louisiana voters are black. And while black turnout can and does differ from election to election, a statewide poll taken with a sample that is only 10% black (or only contains respondents from higher income suburbs) could not and should not be considered a representative sample.
Similarly, there is a world of difference between a poll taken of random names in a phone book, a poll taken of registered voters, and a poll taken of “likely” voters (those on the voter rolls who are shown to take an interest in most elections). In the high turnout 2008 Presidential election, for example, 33% of registered Louisiana voters didn’t vote. Meaning that random calls to anyone in the phone book would have been a waste of time with regards to those not even on the voter rolls, much less the 33% of those on the voter rolls who didn’t vote. In fact, we’d like to bring up a statistic about voter turnout that is generally not mentioned to the public: in a sample of suburban East Baton Rouge Parish voters, 15% of those registered have never voted, and another 13% did not vote in the 2008 Presidential election.
(5) How we analyze polls – When we provide poll analyses for House, Senate, and Governor’s races, we scour the political websites every day to retrieve all relevant polls. Once we load those polls into a database, we assess each race based on a weighted average of polls for the last 28 days. We currently use 28 days for two reasons: (a) it’s relatively early in the election season (22 states, including Louisiana, still haven’t held their primaries), so we don’t have a continuous stream of poll data yet, (b)voters aren’t fully engaged in the election right now. Once Labor Day has passed, trends can and do emerge, so we will shorten the “look back” of the polls we examine to 7-14 days, because we want to be able to detect trends on a more timely manner..
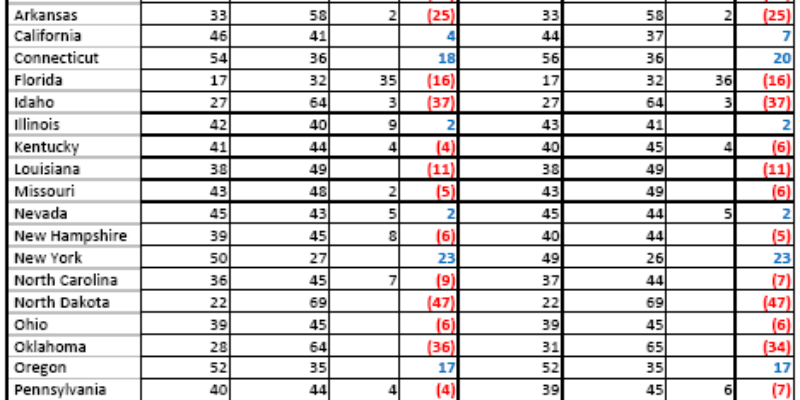
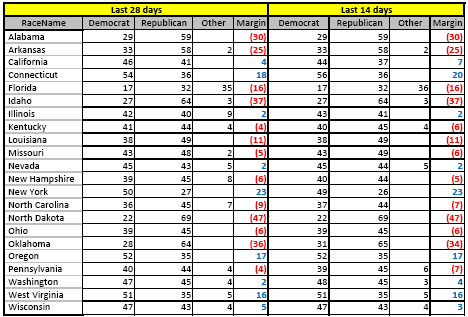
(6) Finally – As a final illustration of what we’ve talked about, we’d like to provide a sample of polls taken for U.S. Senate races, and show you the results within the last 14 and 28 days:
John is a political consultant and blogger with JMC Enterprises with expertise in poll sample development and analysis, development of targeted voter files for phone canvassing or mail outs, campaign strategy and demographic consulting, among other things. See his site at WinWithJMC.com for more information.
Advertisement
Advertisement