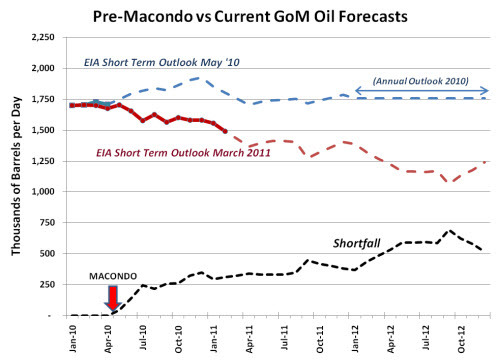
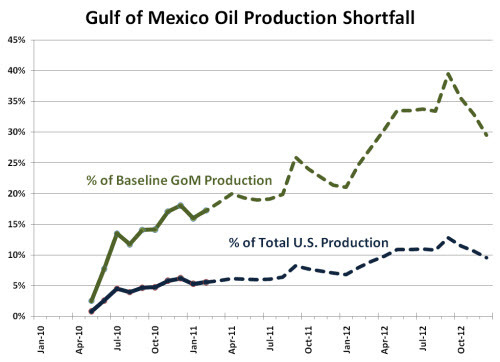
In 2011, Gulf of Mexico oil production will under-perform the government’s pre-Macondo forecasts by 355,000 barrels per day — almost 130 million barrels for the year. In 2012, the shortfall rises to 550,000 barrels per day — 200 million barrels. That’s fully one-third of the Gulf’s oil producing capability, and over 10% of total domestic oil production.
These are staggering numbers.
Alaska, our #1 oil producing state, will supply roughly 200 million barrels in 2012.
Two hundred million barrels is about what the U.S. imports from Iraq every year. Or roughly half of our Saudi Arabian import volume. Two hundred million barrels would supply all of Ohio’s yearly petroleum use, with quite a bit left over.
Replacing 200 million barrels of oil will require an additional supertanker full of oil every two days.
The Department of Energy’s Energy Information Administration (EIA) provides a rather dry but telling explanation:
Off shore oil production in [the 2011 forecast] is lower than in [the 2010 forecast] throughout most of the projection period [through 2035] because of expected delays in near-term projects, in part as a result of drilling moratoriaand in part due to the change in lease sales expected in the Pacific and Atlantic outer continental shelf (OCS), as well as increased uncertainty about future investment in off shore production. [AEO2011 Preview, p. 8. Emphasis added.]
Moratoria, access and uncertainty: issues which fall squarely in the laps of Barack Obama and Ken Salazar. Their misguided policy decisions come in times of rising global demand and rising world tensions. By the fall of 2012, we might look back on the “good old days” of $105 per barrel oil and $3.75 per gallon gasoline.
The projected shortfall comes from EIA forecasts. EIA’s Annual Energy Outlook, with detailed production and consumption forecasts covering the next 25 years, is published each April; AEO2011 is due to be published April 26, but a Preview came out last December.
Short Term Outlooks are published monthly. The most recent STO was published March 8.
The shortfall is the difference between the March 2011 STO (”where we are”) with the May 2010 STO (”where we might have been”). The May 2010 STO was the last monthly forecast which did not take post-Macondo regulatory actions into account. Since the STO only covers a 24-month time frame, supplemental values for 2012 came from last year’s Annual Energy Outlook.
The cumulative shortfall, just through the end of 2012, will be 387 million barrels, plus 723 billion cubic feet of natural gas (which contains the equivalent energy value of about 120 million barrels of oil).
How much are we talking about in dollar terms? Just on the value of the oil and gas alone, over $40 billion dollars worth. Somewhere around $6 billion of that would have flowed straight to the U.S. Treasury as royalty. This analysis is too simplistic to address the real economic cost, in terms of lost jobs, capital investment, income and payroll taxes, etc. Notice in the graph below that the cumulative value really starts to take off in 2012 as the volume loss accelerates.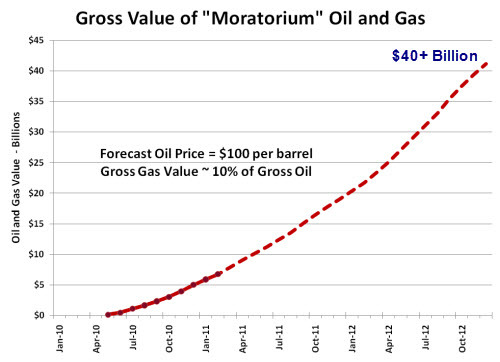
Consider, too, that this shortfall does nothing to curtail demand. Not a single consumer will alter their consumption habits (that is, until the price adjusts). This volume of oil will be made up from imports, adding to our national trade imbalance.
Ultimately, as I have argued before, a half million barrels a day can make a substantial difference in the market price of oil. As we have seen supply disruptions (Libya, Yemen and elsewhere) against growing demand, buyers will inevitably bid up the value of that last barrel to come on the market.
This shortfall could be erased by an administration that correctly viewed the oil and gas industry, not as a convenient whipping-boy, but as a potential growth engine for our tepid economy. Capitalist risk-takers have already proven the potential of oil from shale plays such as the Eagleford of South Texas and the Bakken of North Dakota. We find ourselves at a moment in time when a true visionary in the White House could realistically set a goal of 50% or more growth in domestic oil supply, and couple it with a commitment to develop our plentiful, clean American natural gas resources. Such a visionary leader could become the first president since the 1973 embargo to succeed in putting America on a course to true energy security –
Hey, a fellow can dream, can’t he?
Cross-posted at RedState.com
References
March 2011 Short Term Outlook (Mar 2011 STO) – .xls file
May 2010 Short Term Outlook (May 2010 STO) – .xls file – .pdf file
[Refer to worksheet “4atab” for oil projections, “5atab” for natural gas.]
2011 Annual Energy Outlook Early Release (Dec-2010) – website
Annual Energy Outlook 2010 (AEO2010) – .pdf file
Annual Energy Outlook 2011 (AEO2011) Early Release Overview – .pdf file
“This release is an abridged version of the Annual Energy Outlook that highlights changes in the AEO Reference case projections for key energy topics. The Early Release includes data tables for the Reference case only. The full AEO2011 will be released April 26, 2011.”
2010 & 2011 AEO Annual Projections by Year through 2035 – flash table browser
Advertisement
Advertisement