2010 Election Predictions – How we rank individual races
Our calls on individual races are based on a composite of polls conducted over the last 28 days (we will compress this “look back period” once primary season has concluded in mid September) using the following criteria:
(1) Safe Democratic (dark blue on the map)/Safe Republican (dark red on the map) – either a candidate leads by 10 or more points, or a candidate has over 50% in polls;
(2) Lean Democratic (light blue on the map)/Lean Republican (light red on the map) – a candidate leads by 3-9 points;
(3) Tossup (yellow) – a candidate leads by less than 3 points;
(4) No data available/primary has not been held (gray) – In general, we don’t analyze statewide polls until its primary has been conducted. However, since pollsters have been releasing multiple polls with different Democratic/Republican matchups for states that have not held their primaries, we will modify this rule as follows: if at least one of the major parties has a clear front runner in a contested primary, we will use the various poll matchups to get a sense of how a Senate/Governor race is leaning and, based on that composite of polls in the last 28 days, will assess which party is ahead.
(5) No Senate/gubernatorial race in 2010 for this state (black);
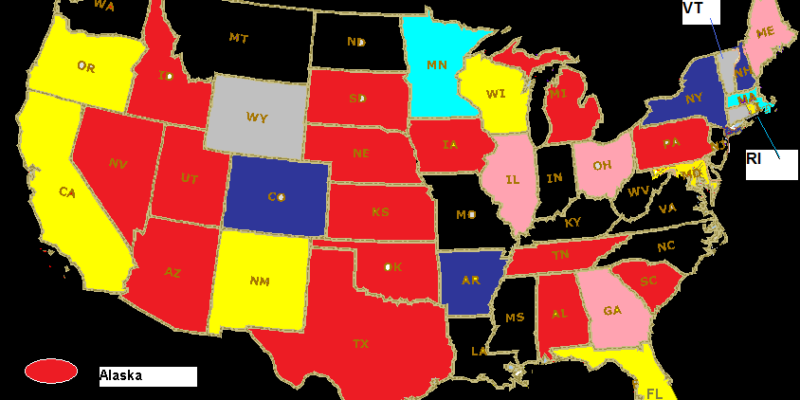
2010 Election Predictions – Senate Races
(7/29, 8/4, and 8/11 projections: 54 Democrats, 46 Republicans, or Republican gain of +5)
Since our last analysis, we have made two changes. Colorado has entered our rankings as a “Tossup”; however, the only available polls available were taken before the primary held this past Tuesday. It’s entirely possible that one of the nominated candidates will get a “post primary bump.” In Nevada, a composite of the last 28 days of polling shows Harry Reid with a slight lead due to one poll taken 27 days ago that showed him with a 7 point lead, so we are reclassifying this race as “Leans Democratic” for now.
Several things on the map are also worth noting: (1) while we have no poll data for the Alaska, Georgia, Hawaii, and Vermont Senate races, we expect that those will be classified as “safe Republican” (for Alaska and Georgia) or “safe Democratic” (for Hawaii and Vermont) as data comes available; (2) though Wisconsin is “leans Democratic”, we need to reiterate that this is a 28 day average of how Russ Feingold would poll against multiple Republican candidates. Against GOP front-runner Ron Johnson, Feingold either trails or is tied in the polls – once Wisconsin holds its primary on September 14, we can probably reclassify this race; (3) beyond Washington, Wisconsin, and California, another Democratic held seat we are watching for possible reclassification is the Connecticut Senate race. Though Democratic Attorney General Richard Blumenthal holds a wide lead, his numbers have been steadily eroding to the point that he is barely above 50%. Now that Connecticut has held its primary, we believe that Blumenthal’s numbers will continue eroding against a defined GOP opponent; (4) in West Virginia, popular Democratic Governor Joe Manchin (the front runner for the special election for the Byrd seat) was recently subpoenaed as part of a grand jury investigation regarding his office’s compliance with bid/state contract requirements – this is not the kind of news that a Democrat, particularly against the backdrop of the Charles Rangel and Maxine Waters ethics investigations, wants to be on voters’ minds.
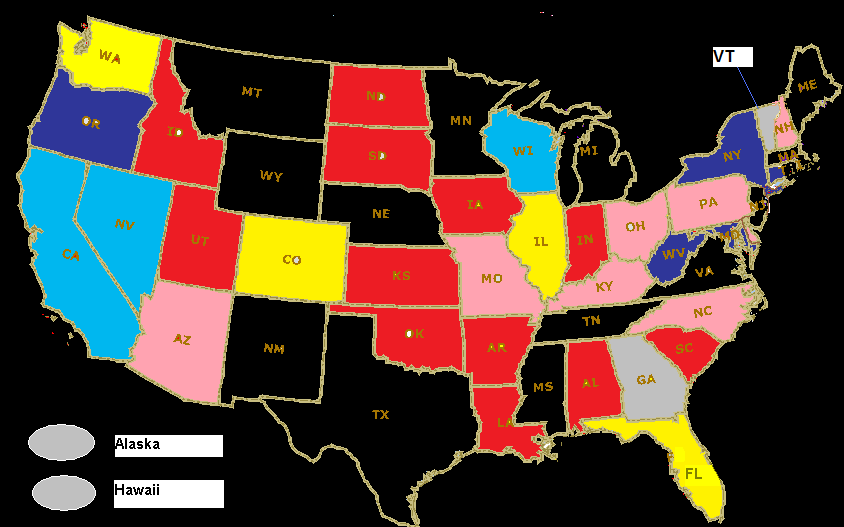
2010 Election Predictions – Governor’s Races

(8/11 projection: 32 Republicans, 18 Democrats, or Republican gain of +8)
(8/4 projection: 31 Republicans, 19 Democrats, or Republican gain of +7)
(7/29 projection: 30 Republicans, 20 Democrats, or Republican gain of +6)
Since our last analysis, there are four modifications we are making to our predictions. Now that we have data for Michigan (it held its primary a week ago) and New Hampshire, we are classifying those races as “safe Republican” (for Michigan) and “safe Democratic” (for New Hampshire). We are also moving Pennsylvania from “lean Republican” to “safe Republican” – 3 of 4 polls taken since July 1 show the Republican with a double digit lead. And in Colorado, the former GOP front runner saw his candidacy rapidly disintegrate after it was revealed that he plagiarized a paper he did on water policy. Not only did he narrowly lose the GOP primary this past Tuesday, but a former Republican congressman has entered the race as a third party candidate. This splitting of the vote has enabled the Democrat to zoom to a healthy lead nearing 50% according to polls taken right before the primary. Therefore, we are reclassifying that race from “leans Democratic” to “safe Democratic.”
A couple of things on the map are also worth noting: (1) while we have no poll data for the Connecticut, Hawaii, Vermont, and Wyoming, we expect to see Connecticut data very soon – they held their primary this past Tuesday; (2) though Arkansas Democratic incumbent Mike Beebe holds a wide lead, the last two polls taken show him barely above 50%. If this trend were to continue, this race could enter our “watch list”, especially since Obama’s ratings in Arkansas are abysmal.
2010 Election Predictions – Generic Congressional Vote
(8/11 poll composite: 45.3% Republican, 41.3% Democrat – +4.0% Republican)
(8/4 poll composite: 45.2% Republican, 41.7% Democrat – +3.5% Republican)
(7/29 poll composite: 44.9% Republican, 42.2% Democrat – +2.7% Republican)
Poll numbers continue to show movement towards Republican in overall voter preference. To put the “Generic Congressional Vote” question in perspective, when Republicans retook the House (and Senate) in 1994, the popular vote in the 435 House districts was 52-45% Republican. If we were to split the undecideds equally between both parties, you would have a 52% Republican vote, which equates to a 226 seat Republican majority – a net gain of 47 Republicans, which is eight more than needed to regain control of the House. We also believe at this time that the 226 seat figure is a conservative estimate, since it doesn’t consider voter intensity which clearly favors the Republicans right now.
2010 Election Predictions – Individual House Races
(8/4 and 8/11 : 257 Republicans/178 Democrats (Republican gain of +78, 19 Democrats on the “watch list”)
(7/29 : 256 Republicans/179 Democrats(Republican gain of +77, 18 Democrats on the “watch list”)
One of the things we have repeatedly mentioned in our discussions of the “Obama plunge” and its effect on the fall elections is that actual poll results take precedence over the theoretical criteria used to determine whether a seat is vulnerable. Additional polling released this past week further amplifies what we’ve been predicting regarding vulnerable Democrats:
Democratic incumbents Leonard Boswell (D-Iowa), Debbie Halvorson (D-Illinois) and Stephanie Herseth Sandlin (D-South Dakota) were in the unfortunate position of being the first few Democratic incumbents with polling released showing them significantly trailing their Republican challengers. Recent polling confirms that they still are trailing; in fact, their poll deficits range from 7 to 11 points. And it further confirms the “Independents are fleeing the Democrats” mantra, because these two of these House districts voted narrowly for Obama, while one of the districts voted narrowly for McCain. In other words, these are the types of districts that enable Democrats to maintain control of the House – for now.
John is a political consultant and blogger with JMC Enterprises with expertise in poll sample development and analysis, development of targeted voter files for phone canvassing or mail outs, campaign strategy and demographic consulting, among other things. See his site at WinWithJMC.com for more information.
Advertisement
Advertisement