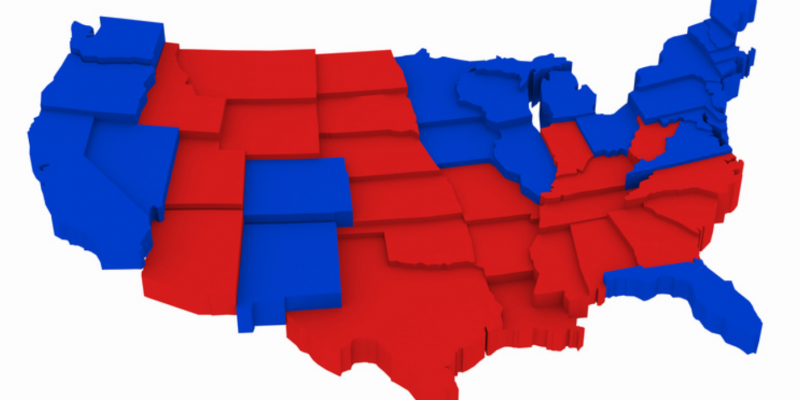
With the delayed Tax Day approaching on July 15, the personal finance website WalletHub released an analysis of the national tax landscape and found that red states generally have a better taxpayer return on investment (ROI) than blue states.
“Tax Day can be a painful reminder of how much we have to invest in federal, state and local governments, though many of us are unaware of exactly what they give us in return,” John S Kiernan, WalletHub’s managing editor, writes. “As a result, this creates a disconnect in the minds of taxpayers between the amount of money we should fork over in April – or July, as is the case this year due to COVID-19 – and how much we deserve in return.”
According to a WalletHub’s Taxpayer Survey, 60 percent of U.S. adults surveyed said they pay too much in taxes; 88 percent said that government officials don’t use tax revenue wisely.
ROI varies based on where taxpayers live, Kiernan said.
“Federal income-tax rates are uniform across the nation, yet some states receive far more federal funding than others,” he added. COVID-19 federal aid also varies widely across states.
Federal funding only tells part of the story, WalletHub notes, because states have vastly differing tax burdens.
“This begs the question of whether people in high-tax states receive superior government services. Likewise, are low-tax states more efficient or do they receive low-quality services?” Kiernan asks.
In its Best & Worst Taxpayer Return on Investment in 2020 report, WalletHub used 31 metrics to compare the quality and efficiency of state-government services across five categories – Education, Health, Safety, Economy, and Infrastructure & Pollution.
The states with the best taxpayer ROI are New Hampshire, Florida, South Dakota, Virginia, Missouri, Ohio, Georgia, Nebraska, Texas and Tennessee. The states with the worst ROI are Vermont, Nevada, Louisiana, Delaware, Arkansas, New York, North Dakota, California, New Mexico and Hawaii.
Red States have a higher taxpayer return on investment, with an average ranking of 21.17, compared to Blue States’ score of 32, with 1 being the best.
The analysis found that the best school systems are in Massachusetts, New Jersey, Connecticut, Virginia and Vermont, whereas the worst are in West Virginia, Mississippi, Arizona, Louisiana and New Mexico.
Tennessee has the lowest proportion of major roads in poor or mediocre condition, or 15 percent, which is 5.3 times lower than Rhode Island’s highest score of 79 percent. Other states with best roads and bridges are Texas, Nevada, Florida and Maryland. States with the worst are Hawaii, South Dakota, Pennsylvania and West Virginia.
States with the lowest percentage of residents in poverty are New Hampshire, Maryland, Hawaii, Connecticut and Minnesota. States with the highest percentage are West Virginia, Kentucky, Louisiana, New Mexico and Mississippi.
“Evidently, you don’t get what you pay for in government services. Data shows no consistent pattern based on citizen satisfaction and tax burden,” Minchin G. Lewis, MPA, CGFM, adjunct professor at the Maxwell School at Syracuse University, says.
“There are over 89,000 separate cities, towns, villages, school districts, and other special service units,” Lewis adds. “They all collect taxes and provide services in one form or another. They all have different structures and external support from state and federal tax transfers. So high taxes do not guarantee good services. Low taxes do not mean unsatisfactory services.”
Advertisement
Advertisement

