The share of Texas adults eligible to receive $1,200 or more from the coronavirus financial relief plan passed by Congress was 82.3 percent, representing 13,773,871 residents, according to an analysis by 24/7 Wall St.
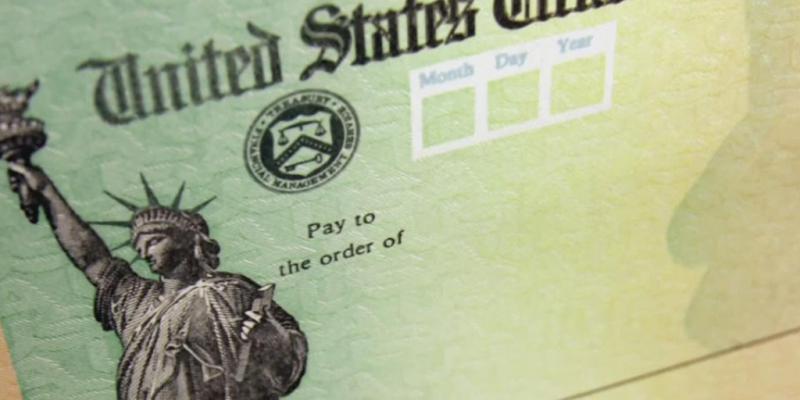
The $1,200 economic stimulus checks, which the U.S. Treasury Department began issuing on April 10, were sent to single adults making under $75,000 annually. And couples earning less than $150,000 each year received $2,400 checks, plus $500 for each of their dependent children. Individuals with higher earnings received less, based on a formula used to help Americans facing economic insecurity due to the Covid-19 epidemic.
In Texas, the average per-capita income is $30,641, with the poverty rate in the state estimated at 14.9 percent, according to 24/7 Wall St. The state’s July unemployment rate was projected to reach 15.2 percent, the financial services website reported.
Generally, those states where a higher percentage of adults receive the full coronavirus stimulus amount have more lower-income households, the analysis states. Many of these states were dealing with poor economic conditions even before the Covid-19 health emergency began, according to 24/7 Wall St.
—
Number of People Receiving $1,200 Covid-19 Checks by State
| State | % of Adults Eligible for Stimulus Checks | # of Adults Eligible for Stimulus Checks | Per Capita Income | Poverty Rate | Projected Jobless Rate for July 2020 |
| Alabama | 95.4% | 2,774,091 | $27,525 | 16.8% | 14.5% |
| Alaska | 93% | 379,389 | $35,735 | 10.9% | 17.8% |
| Arizona | 87.3% | 3,638,130 | $30,530 | 14% | 15.4% |
| Arkansas | 93.6% | 1,632,544 | $26,626 | 17.2% | 15.3% |
| California | 78.3% | 18,649,688 | $37,124 | 12.8% | 15.6% |
| Colorado | 88.4% | 2,812,210 | $38,057 | 9.6% | 14.1% |
| Connecticut | 84.7% | 1,784,775 | $44,026 | 10.4% | 14.8% |
| Delaware | 90.2% | 518,784 | $33,745 | 12.5% | 16.8% |
| Florida | 86.4% | 11,152,974 | $31,359 | 13.6% | 15.5% |
| Georgia | 89.4% | 5,460,553 | $31,187 | 14.3% | 14.9% |
| Hawaii | 87.5% | 781,295 | $35,255 | 8.8% | 17.8% |
| Idaho | 93.1% | 944,035 | $27,816 | 11.8% | 14% |
| Illinois | 86.7% | 6,418,887 | $35,801 | 12.1% | 15.6% |
| Indiana | 93.8% | 3,563,960 | $29,369 | 13.1% | 15% |
| Iowa | 93.2% | 1,618,130 | $31,559 | 11.2% | 14.2% |
| Kansas | 91.9% | 1,487,466 | $31,456 | 12% | 14.7% |
| Kentucky | 95.2% | 2,449,104 | $27,823 | 16.9% | 16.3% |
| Louisiana | 94.6% | 2,498,151 | $27,274 | 18.6% | 18% |
| Maine | 95.7% | 723,727 | $32,095 | 11.6% | 15.7% |
| Maryland | 85.1% | 3,063,148 | $41,522 | 9% | 13.9% |
| Massachusetts | 84.3% | 3,324,474 | $43,349 | 10% | 15.1% |
| Michigan | 93.6% | 5,407,952 | $31,508 | 14.1% | 15.2% |
| Minnesota | 90.8% | 2,837,704 | $37,192 | 9.6% | 15% |
| Mississippi | 96.5% | 1,663,851 | $24,160 | 19.7% | 17.5% |
| Missouri | 94.9% | 3,294,553 | $30,498 | 13.2% | 15.7% |
| Montana | 96.5% | 571,406 | $30,680 | 13% | 16.3% |
| Nebraska | 91.9% | 968,916 | $31,771 | 11% | 15.1% |
| Nevada | 83.7% | 1,462,204 | $31,604 | 12.9% | 19.7% |
| New Hampshire | 93.1% | 749,682 | $39,521 | 7.6% | 15% |
| New Jersey | 81.9% | 4,497,924 | $42,815 | 9.5% | 15.6% |
| New Mexico | 90.7% | 1,075,691 | $26,529 | 19.5% | 16.2% |
| New York | 83.1% | 9,439,317 | $38,884 | 13.6% | 1640.0% |
| North Carolina | 90.8% | 5,484,666 | $30,737 | 14% | 15.5% |
| North Dakota | 93.1% | 367,102 | $34,848 | 10.7% | 15.6% |
| Ohio | 94.5% | 6,244,889 | $31,293 | 13.9% | 16.4% |
| Oklahoma | 92.8% | 2,087,995 | $28,011 | 15.6% | 14.7% |
| Oregon | 89.4% | 2,127,760 | $34,058 | 12.6% | 15.5% |
| Pennsylvania | 92.7% | 6,923,325 | $33,960 | 12.2% | 16.6% |
| Rhode Island | 89.4% | 543,658 | $34,999 | 12.9% | 15.4% |
| South Carolina | 94.9% | 2,828,616 | $28,957 | 15.3% | 15% |
| South Dakota | 96.9% | 456,440 | $29,953 | 13.1% | 15.8% |
| Tennessee | 93.5% | 3,697,213 | $29,284 | 15.3% | 15.8% |
| Texas | 82.3% | 13,773,871 | $30,641 | 14.9% | 15.2% |
| Utah | 90.5% | 1,642,281 | $29,756 | 9% | 14.8% |
| Vermont | 95.0% | 318,178 | $33,956 | 11% | 15% |
| Virginia | 87.4% | 4,341,048 | $38,900 | 10.7% | 14% |
| Washington | 86% | 3,717,760 | $39,119 | 10.3% | 15.2% |
| West Virginia | 97.8% | 1,029,202 | $26,179 | 17.8% | 16.3% |
| Wisconsin | 93.9% | 3,066,598 | $33,032 | 11% | 15.6% |
| Wyoming | 95.6% | 300,410 | $33,522 | 11.1% | 16.3% |
Source: 24/7 Wall St.
Advertisement
Advertisement

