2010 Election Predictions – How we rank individual races
Our calls on individual races are based on a composite of polls conducted over the last 28 days (we will compress this “look back period” once primary season has concluded) using the following criteria:
(1) Safe Democratic (dark blue on the map)/Safe Republican (dark red on the map) – either a candidate leads by 10 or more points, or a candidate has over 50% in polls;
(2) Lean Democratic (light blue on the map)/Lean Republican (light red on the map) – a candidate leads by 3-9 points;
(3) Tossup (yellow) – a candidate leads by less than 3 points;
(4) No data available/primary has not been held (gray) – In general, we don’t analyze statewide polls until its primary has been conducted. However, since pollsters have been releasing multiple polls with different Democratic/Republican matchups for states that have not held their primaries, we will modify this rule as follows: if at least one of the major parties has a clear front runner in a contested primary, we will use the various poll matchups to get a sense of how a Senate/Governor race is leaning and, based on that composite of polls in the last 28 days, will assess which party is ahead.
(5) No Senate/gubernatorial race in 2010 for this state (black);
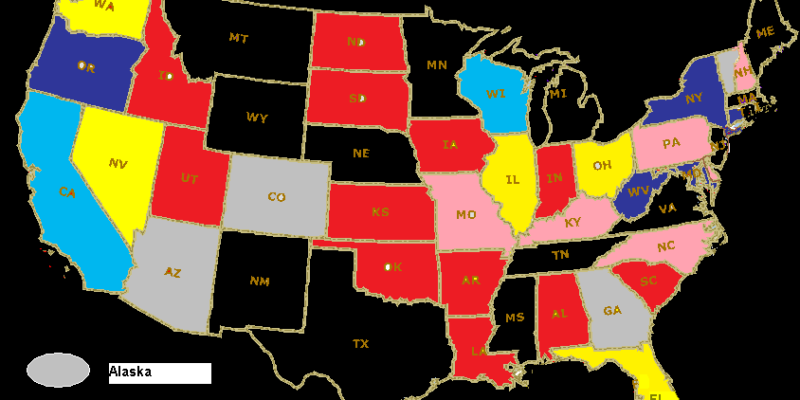
2010 Election Predictions – Senate Races

(7/22 and 7/29 projection: 54 Democrats, 46 Republicans, or Republican gain of +5)
(7/14 projection: 55 Democrats, 45 Republicans, or Republican gain of +4)
Since our last analysis, we now have poll results for West Virginia. We are also changing the classification of two Senate races. In Missouri, Obama’s abysmal ratings have made it more difficult for the Democrat to capture this open Republican seat, and the Republican candidate has increased his poll lead from 47-45% to 48-42%. In California, a tossup Senate race has moved to “lean Democratic”, since the last three polls taken both show three term incumbent Boxer leading by more than 5%.
2010 Election Predictions – Governor’s Races
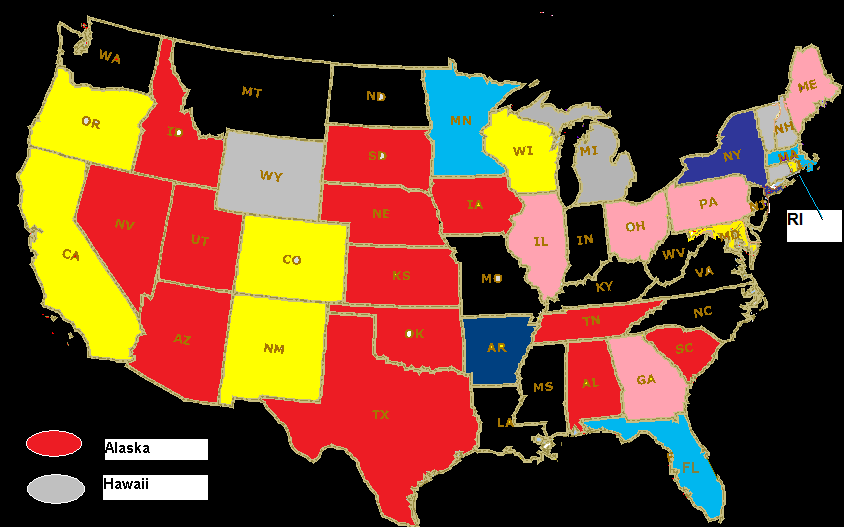
( 7/29 projection: 30 Republicans, 20 Democrats, or Republican gain of +6)
(7/22 projection: 29 Republicans, 21 Democrats, or Republican gain of +5)
(7/14 projection: 31 Republicans, 19 Democrats, or Republican gain of +7)
Since our last analysis, we now have polls we can analyze for Alabama, Georgia, Idaho, Massachusetts, and Rhode Island. We have increased our estimate of Republican gains from 5 to 6, because in Ohio, the last two polls taken show Republican John Kasich inching closer to 50% while maintaining a comfortable lead over the Democratic incumbent.
One thing we’d like to note in this analysis is the effect of third party candidacies on the outcome. Though poll averages show Democrats in the lead in Florida, Massachusetts, and Minnesota, a closer examination reveals that in those states, third party candidates are pulling 11-17% of the vote, enabling the Democrats to lead in the polls despite the fact that those “leads” in all three cases are with less than 40% of the vote. And in Rhode Island, the third party candidate for governor (former Republican Senator Lincoln Chadee) actually has a 37-32% lead over the Democrat.
Battle for Congress and Governor – House Races
(7/29 projection: 256 Republicans and 179 Democrats, or Republican gain of +77 – 18 Democrats on the “watch list”)
(7/22 projection: 258 Republicans and 177 Democrats, or Republican gain of +79 – 17 Democrats on the “watch list”)
(7/14 projection: 261 Republicans and 174 Democrats, or Republican gain of +82 – 14 Democrats on the “watch list”)
We had remarked in this post that while we are using theoretical criteria to estimate the change in partisan composition of the House, there is an even more important criteria: actual poll results as they become available. This past week, more polls have been released which enable us to have a clearer picture of seven House races involving incumbent Democrats. First, poll numbers for four incumbent Democrats previously classified as vulnerable show that, indeed, voters do not support their re-election, as they trail their Republican opponents by 6 to 12 points. We are also reclassifying the status of three incumbent Democratic Congressmen, due to recent poll numbers/incidents:
(1) Recent polling shows two term incumbent John Yarmuth (D-Kentucky) with a commanding 58-32% lead in an urban (Louisville) district that voted 56% for Barack Obama – we are therefore moving him from “Vulnerable” to “Safe Democratic”, despite a voting record that was down the line in support of the Democratic leadership;
(2) Recent polling shows 14 year incumbent Ron Kind (D-Wisconsin) with a 44-38% poll lead in a rural district bordering Minnesota that voted 58% for Barack Obama – in this case, we are moving him from “Vulnerable” to “Watch List”, as Rep. Kind also had a voting record that supported the the Democratic leadership;
(3) Last month, we put 6 year incumbent Ben Chandler (D-Kentucky) on the watch list, since he had a 45-38% lead in the polls. A recent poll came out showing him extending this lead to 46-32%. If his numbers continue to improve, we will reclassify him from “watch list” to “safe Democrat”, but for now, we’re keeping him on the “watch list”;
(4) We have yet another addition to the “Congressmen behaving badly” list: Barney Frank of Massachusetts created a scene recently when he didn’t receive a $1 senior discount to ride a ferry in New York – this discount was only for New York residents possessing the “senior discount card.”
2010 Election Predictions – Generic Congressional Vote
(7/29 poll composite: 44.9% Republican, 42,2% Democrat – +2.7% Republican)
(7/22 poll composite: 44.5% Republican, 42% Democrat – +2.5% Republican)
(7/15 poll composite: 45.1% Republican, 42.7% Democrat – +2.4% Republican)
Poll numbers continue to show a small trend towards Republican voter preference in the Congressional race, with three out of four polls taken in the past week indicating a slight overall Republican preference. To put this in perspective, when Republicans retook the House (and Senate) in 1994, the popular vote in the 435 House districts was 52-45% Republican. The 2.7% lead for the Republicans we have calculated would roughly translate to a 223 seat Republican majority, or a net gain of 44 Republicans.
Final Thoughts
As of today, 28 states have held their primaries, and all states but Delaware have concluded their candidate filing. The Oklahoma primaries held this past Tuesday were noticeable in three ways: (1) like New Mexico, both of the major party nominees for Governor are female, (2) a contested Democratic primary showed yet again (like in the Utah primary in June) that Democrats who voted against healthcare reform will NOT be punished by Democratic primary voters, despite threats of electoral revenge uttered by liberal groups. In this case, Dan Boren (D-Oklahoma) was renominated with 76% of the Democratic primary vote against a more liberal state senator, and (3) Republicans supporting TARP have consistently lost support in their primaries – the latest “Exhibit A” was 9 year incumbent John Sullivan, whose TARP vote led to his surviving his primary with a reduced 62% of the vote.
Staring next Tuesday, we are about to enter a busy cycle of primary elections, which will last until August 28 when Louisiana holds its partisan Congressional primaries (West Virginia is also holding party primaries for the Byrd seat on that day as well).
John is a political consultant and blogger with JMC Enterprises with expertise in poll sample development and analysis, development of targeted voter files for phone canvassing or mail outs, campaign strategy and demographic consulting, among other things. See his site at WinWithJMC.com for more information.
Advertisement
Advertisement